

GA4 and Search Console
First Step
Imagine that you Open a store. Then hang up a sign, but never count the customers inside. You stay blind to results, no idea if the sign pulls people, no clue which items catch eyes, no sense of why they leave empty handed.
A website without tracking tools faces the same issue. You can add post after post. The work brings no insight without numbers.
Two free Google tools fix this for beginners. They are Google Analytics 4 and Google Search Console. They answer basic questions new users have. I will cover what each shows, explain how they differ and the steps to start.
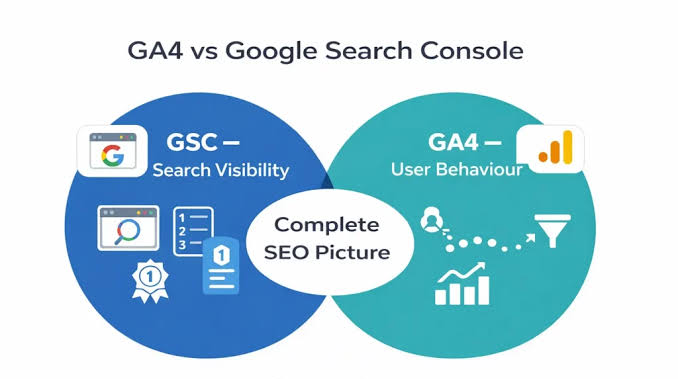
The basic difference:
- Search Console reports activity before visitors hit your site. It reveals how they found you on Google. It lists the exact terms they searched.
- GA4 reports activity after they land on your pages. It tracks which content they read. It measures how long they stayed and follows their next clicks.
Both tools together give the complete view you need.
Part 1 : Google Search Console
What it does?
Search Console is a free tool that shows how your website performs in Google Search. It also warns you if Google has trouble reading your pages.
How to set it up ?
1. Go to the Search Console page. Sign in with a Google account.
2. Add your site as a property.
3. Prove ownership. WordPress users can use plugins like Yoast or Rank Math. They handle verification fast. Or add the code Google gives.
4. Submit your sitemap. Most SEO plugins build one. This speeds up discovery by Google.
You need to wait for a few days because data takes time to appear.
- The Four main numbers to know:
Open the Performance report and you will see Four numbers stand out right away.
- Clicks count visits from Google search results.
- Impressions count how often pages appeared in results. Users saw them but may not click.
- CTR means click through rate ,Clicks divided by impressions, shown as a percentage
- Average position shows usual rank. Position one sits at the top.
- Here is an example. One thousand impressions and thirty clicks equals 3 percent CTR. High impressions but low clicks mean weak titles. You can improve them.
The Queries Tab:
Beginners check this part often. It lists exact search terms that led to your pages. Many terms surprise the site owner. One useful move. Sort for terms where you rank 8 through 20. Look for solid impression counts. Those pages sit near page one. Tweak headings or titles to push them higher.
Few More useful reports:
Pages : Pages shows your top traffic winners from Google.
Indexing : Indexing lists pages Google added. It flags pages left out and requests indexing for new posts.
Mobile and Page experience report : Mobile reports highlight issues that hurt phone use.
Also note that , Search Console stores about 16 months of data. So, it is worth checking regularly.
Part 2 : Google Analytics 4
What it does?
GA4 serves as Google’s main analytics platform now. It replaced an older version in 2023. This tool follows visitor actions on your pages.
How to set this up?
1. Build a free account. Create a GA4 property inside it.
2. Copy the measurement ID. It starts with G and a dash.
3. Link the ID to WordPress. The Site Kit plugin joins both tools at once. You can add the code by hand too.
4. Visit your site. Open the real time report. Confirm the tool sees activity.
Now let is see How GA4 works:
Past tools counted views and visits. GA4 centers on events instead. An event covers any user move. Page loads, scrolls, clicks all count as events. No need to master events yet. Know that GA4 records actions , you get to decide which ones matter most.
Important numbers:
- Users counts unique visitors to the site.
- Sessions counts the number of total visits. One person can create several.
- Engaged sessions count visits over 10 seconds. They count multiple page views or key actions. Engagement rate shows the percent engaged.
- Average engagement time tracks active time spent.
- Key events mark actions you value. Contact clicks and form sends belong here. They used to be called conversions.
GA4 also shows Bounce rates. It equals one minus engagement rate. High bounce rates do not always signal trouble. Quick answers can cause fast exits. Look at the full picture each time you use this.
Reports to open first:
- Acquisition reveals traffic sources. Google, social, direct entry all appear. You learn which paths succeed.
- Engagement lists top pages. It shows time spent on each one.
- Demographics shows countries, devices, and browsers. They help spot mobile user counts.
- Real time shows current visitors right now.
What happens when you combine both tools?
1. The tools gain power when used side by side. Consider one case.
2. Search Console shows a guide post with high impressions but low clicks. The title needs sharpening.
3. Rewrite the title. Make it direct and exact.
4. Switch to GA4 next. Check if visitors read deep or exit fast.
Fast exits suggest the first lines fail to match searches. Edit that section right away. This cycle of review, edit, and review defines analytics. Employers seek this habit. Then, link the tools through Site Kit. Search Console data then appears in GA4 views.
Let us create a simple Weekly habit :
- Limit time. Ten minutes per week works well.
- Check Search Console for the past 28 days. Note clicks, impressions, and top terms.
- Hunt for pages ranked 8 to 20. Improve one of them each week.
- In GA4 review top traffic sources. Check favorite pages too.
- Scan device data. Heavy mobile use means test on a phone.
Pick one change for the week. Review results seven days later.
Errors new users repeat:
- They scan numbers with no question ready. Start with a clear goal.
- They fixate on small totals. Fresh sites grow slowly. Track patterns over weeks.
- They forget to block their own visits. Personal clicks skew results. Add a filter later.
- They skip privacy notes. Share a clear policy with visitors.
- They demand quick wins. Changes need weeks to show up.
- They ignore Search Console. Many load only GA4. This tool uncovers discovery paths.
The Takeaway : Expert status is unnecessary here. Search Console uncovers how users find you. GA4 reveals their on site behavior. Activate both tools now. Review them weekly. Adjust one item at a time. Value sits in the routine. Ask what the numbers mean. Decide on next actions. Form the habit early. You pull ahead of most beginners.
Add both tools to your blog right away. Write a brief section on first week observations. Small numbers are fine. The detail makes the article personal. It also creates proof you can show others.